
Discover the detailed Bitcoin price predictions for 2024-2025 by the acclaimed analyst PlanB.
Delve into his insights on post-halving values, the Stock-to-Flow model, Market Cycle Model, and essential technical analyses, offering a nuanced view of Bitcoin's future trajectory.
Contents
- 1 Predictions of Bitcoin's Value Surge Post-Halving by Expert Analyst PlanB
- 2 Bitcoin Price Predictions Based on the Stock-to-Flow (S2F) Model
- 3 Predictions Based on Bitcoin's Market Cycle Model (MCM)
- 4 Technical Analysis - Relative Strength Index (RSI)
- 5 Technical Analysis - 200-Week Moving Average (200WMA)
Predictions of Bitcoin's Value Surge Post-Halving by Expert Analyst PlanB
Renowned analyst PlanB, known for his Bitcoin (BTC) price forecasts, announced on January 11, 2024, that he expects the BTC price to reach $55,000 at the halving, $100,000 in 2024, and a significant $532,000 in 2025.
PlanB, a prominent analyst with over 1.9 million followers on platform X, is recognized for his Bitcoin price predictions using models like Stock-to-Flow (S2F).
These predictions were shared in a YouTube video released on January 4th, where he detailed his expectations for the future of Bitcoin.
Bitcoin Price Predictions Based on the Stock-to-Flow (S2F) Model
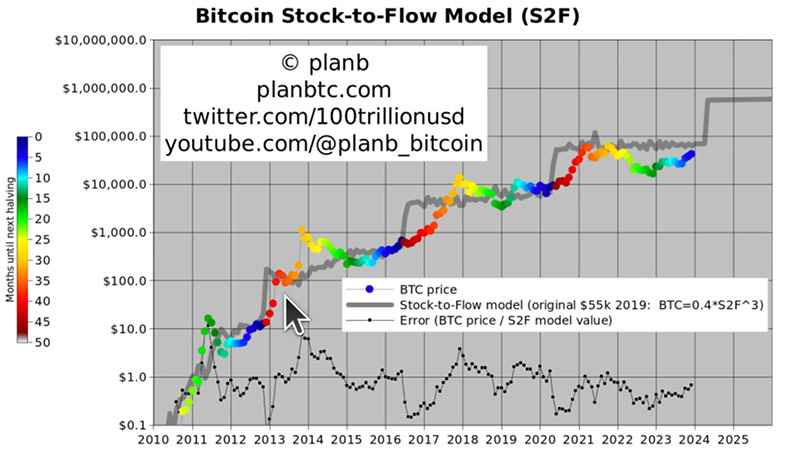
According to the Stock-to-Flow (S2F) model, the BTC price is forecasted to reach $532,000 post-halving.
Historical patterns suggest that Bitcoin prices tend to approach the predicted S2F model price at halving, with the current model value being between $50,000 and $60,000. Therefore, BTC price is likely to rise to this range in the next four months.
However, the price of BTC does not surge immediately post-halving but tends to increase gradually, leading to the expectation of a steady rise towards $532,000 post-halving.
Predictions Based on Bitcoin's Market Cycle Model (MCM)
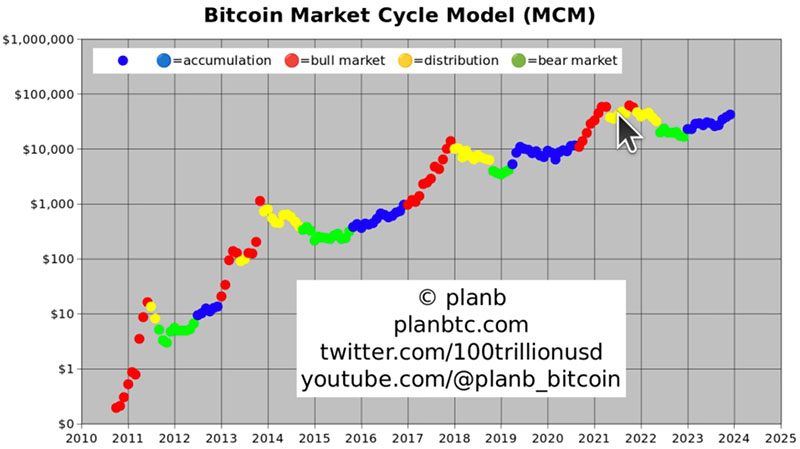
The Market Cycle Model (MCM) for Bitcoin indicates that Bitcoin is currently in the "accumulation phase." The MCM is not a prediction chart but a model to understand which phase BTC is in at any given time.
Based on this model, the current phase is seen as the "accumulation stage," where investors are gathering BTC, expected to be followed by a "bullish phase."
In the early bullish phases, a 100-fold price increase was observed, but the momentum has decreased over time, with recent bullish markets showing a tenfold price increase.
Technical Analysis - Relative Strength Index (RSI)
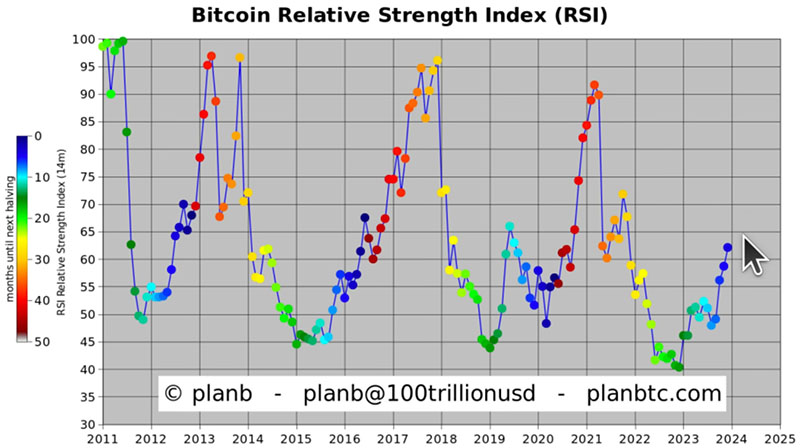
The Relative Strength Index (RSI) is an indicator used to determine overbought or oversold conditions, fluctuating between 0 and 100 (near 100 indicates overbought, while near 0 indicates oversold).
The RSI for Bitcoin hovered below 50 in the first half of 2023 but rose to around 65 in the latter half.
Historically, when the RSI value surpasses 50, Bitcoin tends to enter an upward trend, suggesting a potential gradual price increase for Bitcoin in the future.
However, this chart does not allow for determining how high BTC might climb.
Technical Analysis - 200-Week Moving Average (200WMA)

Based on the 200-week moving average (approximately 4 years), Bitcoin's halving events typically lead to a price increase of double or about 50% of this line.
With the current 200WMA at $30,000, the next halving could see a price increase to between $45,000 and $60,000, similar to the predictions made by S2F and RSI.
In his video, PlanB also discusses Bitcoin price predictions using several other charts. All the content shared by him can be viewed in "this video."
>> To view other price predictions, click here.
-


Binance Research Publishes Report: "2023 Year in Review & Themes for 2024"
Explore the in-depth 2024 cryptocurrency outlook and 2023 review in Binance Research's comprehensive 140-page report, covering key trends and projections.
続きを見る